Part 1 of 2
(read part 2 here)
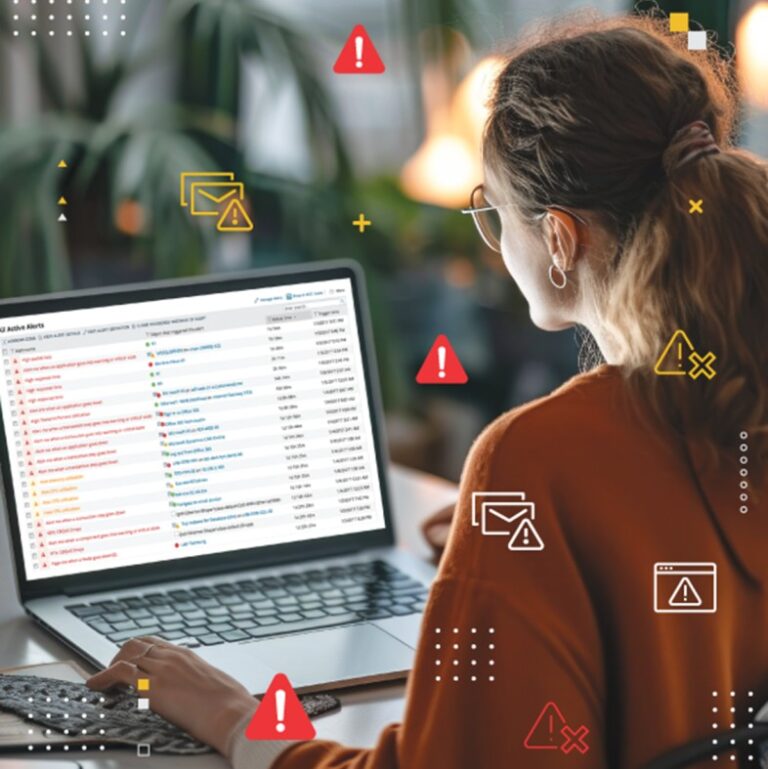
While working with my clients to help them set up monitoring systems I often see the same trouble spots come up. It is surprisingly easy to set up any monitoring system in a way that causes a flood of red and green blinking lights and hundreds of alerts each day that provide more heat than light when it comes to keeping an eye on your infrastructure.
You can improve the effectiveness of the monitoring system by employing a few techniques. As we primarily work with the Solarwinds suite of products I will use that as a reference point, but these concepts apply universally.
What to monitor?
If your resources for the monitoring system are unlimited then the easy answer to this is – everything.
In practice, very few organizations commit unlimited resources to monitoring. You find yourself limited in terms of server resources for the monitoring system itself, or network capacity to the polled objects, or sometimes just based on software license limitations.
It might be nice to have down-to-the-minute data points going back 2 years for everything from the firewall to the workstations but that can take a lot of CPU and IOPS to be able to query all those data points and load it onto a web page in a reasonable amount of time. Whatever your limitations are you will need to consider those when setting up your system.
Bring in the highest impact infrastructure first, and then progressively expand coverage to the less critical systems. On the network side this is typically Firewalls and/or routers, core and distribution switches, and then access switches. You might start out with just monitoring the uplinks between network devices rather than monitoring and alerting on every single port.
You will also want to think about if you get any useful information from monitoring some types of virtual interfaces such as loopbacks, nulls, or routed subinterfaces. If I have the option, I like to set up monitors for hardware like UPS systems and CRAC units because I like to bring all the data to the central pane of glass, but in a squeeze these types of appliances typically have adequate alerting capabilities built in and might need to be skipped until more resources become available.
On the Application monitoring side of things, I try to start out with at least checking that my important processes and services are running and then expand into the less clear cut things like performance counters and synthetic transactions. Depending on the importance of a system I might just do a basic check if my website loads rather than pulling a dozen performance metrics about how many active connections the web server has and how many bytes of pages are being transmitted.
You will want to always check yourself by asking “What am I going to be able to do with the information that I get from monitoring this?” I’ve seen people monitoring IP addresses that nobody has any idea what they are for, but they picked up it up as part of a scan and never got any further than that.
How Frequently to Monitor?
Look at your business needs, the resources of your monitoring tool, and your workflow when it comes to reacting to alerts to figure out how frequently you need to poll.
Checking for up/down status every 30 seconds might sound like a good idea but if you know that your team is so stretched that they rarely get around to looking at incoming messages then building that tight interval into the monitoring system is just going to inflate your hardware requirements without providing a measurable difference in the resolution times.
If your polling system is having a hard time keeping up, then making small increases in the time between polls can help. On the other hand, if you have important WAN interfaces that are getting hammered and you need to focus on that then perhaps you could increase the frequency of the monitoring on just those key interfaces.
You just need to keep track of wherever you have adjusted your standard intervals and why so that you have granularity where it helps and not where it is excessive.
When thinking about the workflow, is anyone in your environment going to jump up at night if CPU loads go high for a minute or would loads need to stay high for a sustained period before anyone would be bothered to check it out?
If you know your team wouldn’t investigate a load issue that didn’t last 30 minutes, then a 5-10 minute polling interval for CPU is probably just fine. If the app team complains that their server has erratic spikes in load that aren’t showing up in the monitoring and they are having a hard time correlating that to the other performance counters you are looking at on the server then you may have a case for a tighter interval, at least temporarily while the issue is investigated.
How to organize the monitored objects?
If your environment is going to be larger than a small office then it is important for you to think through how you want to organize the object you are monitoring.
In any good monitoring software, you will find some method in place to categorize things and with Solarwinds that is done with Custom Properties. These are essentially tags that can be applied to a monitored object that you can reference elsewhere, such as when you are building alerts, reports, or dashboards.
You need to think about how your environment is laid out and how to translate that into your organizational scheme. Are there separate Production and Dev environments? Are IT assets associated with specific teams or departments? Are there existing SLA’s associated with different types of objects that would dictate your response to an alert?
If you have external support or maintenance contracts, what is the contact information of the vendor who supports that system? What applications are associated with a server? What job does that server do within the application?
If you already have any kind of existing CMDB then there is a good chance that the information you need already exists there and if you match up the tags in the monitoring tool to the fields being used in the CMDB you can import the information into the monitoring tool and ensure consistency across the tools your organization uses.
Populating all this kind of information directly in the monitoring tool allows you to pull that information up alongside the monitored metrics and streamline the response in case of an issue.
If you are doing an integration from the monitoring tool to your ticketing system, then you would need to tag the monitored objects with all the necessary information to direct tickets to the appropriate queues.
In part 2 I will be discussing how to use thresholds and build dashboards that make it easy to sift through all the data that your monitoring tool is bringing in.
Marc Netterfield
Field Systems Engineer


