We’ve all been there. That same application admin has bonked his own server yet again. Only, for some nonsensical reason it’s your fault. Yes, you the Network (or SysAdmin) guy (or girl).
So, he complains to your boss who tells you to look at everything up and down the stack and waste the next hour or two proving it’s not your fault.
If this scenario sounds familiar, then have I got a solution for you (and you probably already own it)!
I’d like to introduce you to PERFSTACK. Using PERFSTACK, I’m going to show you how to turn that next two hour slog into a two minute coffee break.
In this example, I’m using the SolarWinds Demo site because they have a lot of devices. Also, we are going to utilize PERFSTACK alongside APPSTACK to make this wizard-like sorcery happen.
You can access the SW Demo site here. http://oriondemo.solarwinds.com/Orion/appstack/Default.aspx?Z=c2c856c0783e4ff5ad2c2122b8dd10a8
We’re going to apply the filter pictured below to the server lab-dem-spapp01 and let’s just say this is the server your Application Admin keeps breaking.
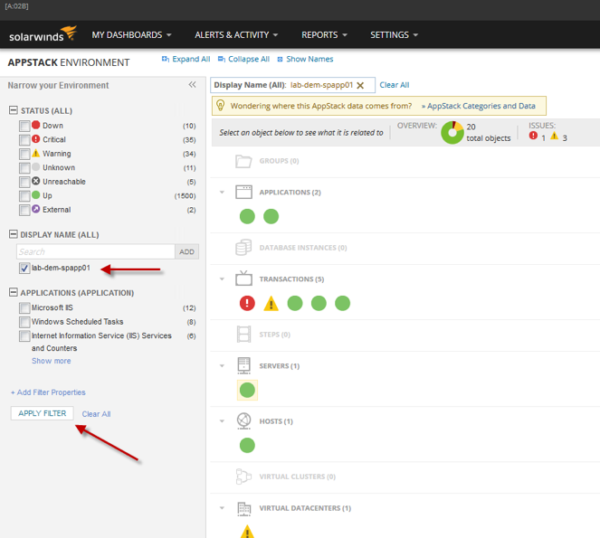
Once the filter is applied the right half of your screen should like similar to the screenshot above. This is every device in the stack that is related to that application server. You may want to take a screenshot of this view because you’ll need to refer to these device names later.
It also includes the applications being served up. Storage, Virtualization, Server, and Database will all be seen in a single view.
Next, let’s open up a new PERFSTACK analysis.
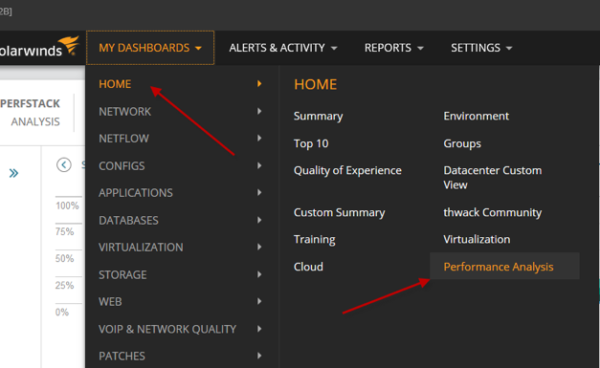
Within the SolarWinds Demo site, under the My Dashboards tab, click on Performance Analysis.
Next, click the “New” plus sign on the right of the screen to create a new project.
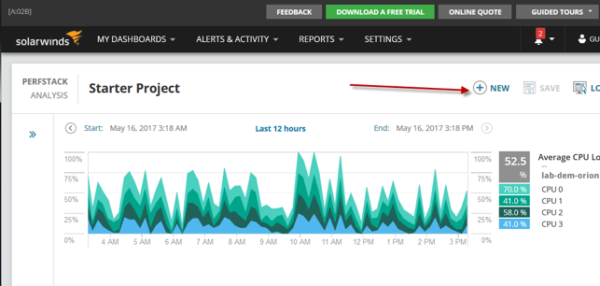
Once you get the new project open we’ll start adding all the devices from your Appstack screenshot. Do this by first clicking the double arrow in the top left corner.
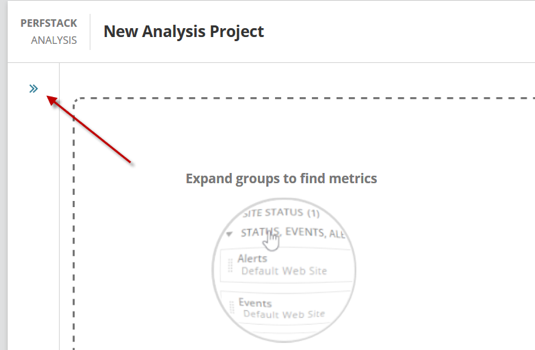
This opens up a view where you can find/add entities, as seen in the screen shot below.
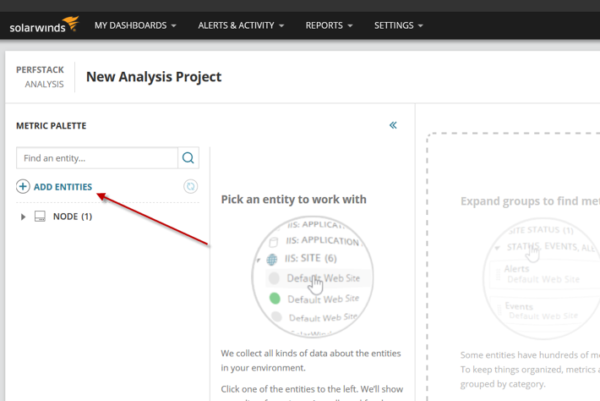
To begin, let’s search for the same device we noted above (lab-dem-spapp01). Then click “ADD SELECTED ITEMS” to complete this step.

Continue adding all the devices until you have the view pictured below:
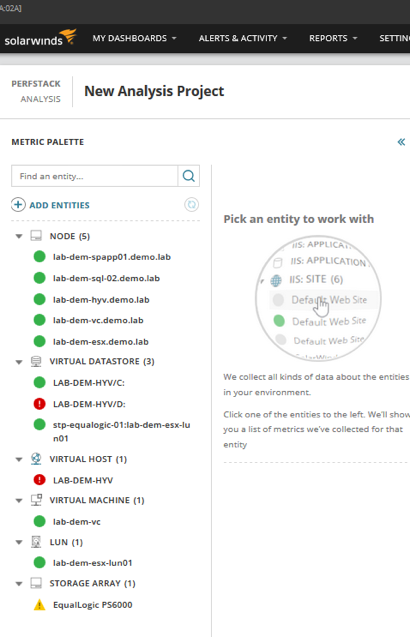
Select each device, one at a time. Then you’ll see the available metrics pop up to the right. You can drag whichever metric you want to see over to the right (the analysis area).
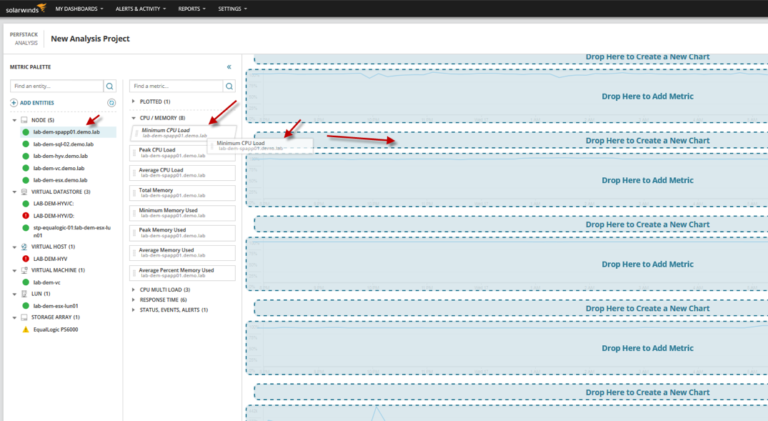
Here is what your PERFSTACK view should look like. Link to Saved PERFSTACK analysis
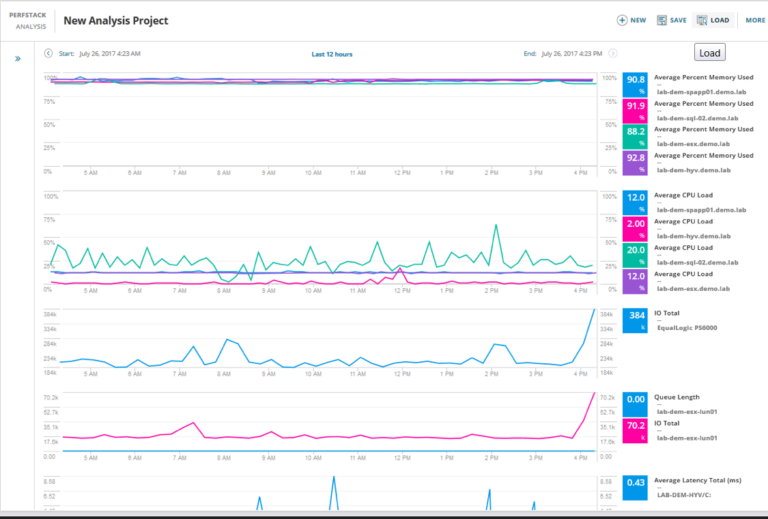
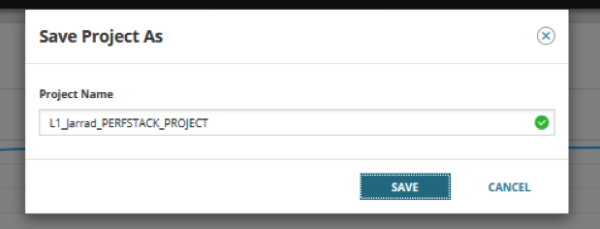
The beauty of this is that you can save this work as a ‘project’ (pictured below). You can also just save the link (which I’ve done for you above).
So, the next time Alex, the Application Admin (I-broke-my-application-server Admin) comes over and complains about how his server isn’t working, you can take comfort knowing that PERFSTACK is only a few clicks away.
In the time it would take you to grab a coffee, you can have a clear and detailed view that identifies his server as the root cause. Enjoy!
Jarrad Shiver
Sales Engineer


